Data-Backed Tips: Audio Measurement Beyond the Click
Nov 16, 2022Digital marketing gave us the click, allowing marketers to track responses to everything from display ads to emails. But clicks are a narrow measurement and can do a disservice to the true impact of your campaigns—especially when it comes to digital audio. Before you obsess over last-click attribution, think about your behavior when you hear an ad. You may do a search in a few hours or go directly to the website a few days later—you know, when you aren’t in the middle of driving, working out, or cooking dinner.
We collected and analyzed the data and worked with our research partners to demonstrate the power of audio and help you look past the click. Let’s dig into audio measurement.
Marry Methods with Medium
Find KPIs that work for digital audio. Setting up appropriate measurement during the campaign planning phase will help you drive toward key insights and inform optimization. From audibility (was your ad heard?) to studies lift and recall (was your ad effective?), to lookback window (what was the full impact?), and more, digital audio campaigns are measurable when you use the right methods.
Ensure that all teams touching the campaign, including creative, understand the KPIs and measurement plan.
TLDR: Methodologies should reflect the nuances of audio.
Make Data Quality a Priority
The strength of digital audio is its ability to target audiences with laser precision, making the most of your ad spend. From the listeners you want to reach to the what, where, and when of the content they listen to, data is the foundation of a successful campaign. Not every publisher has the depth of information you need to make your audio ads effective. But we do.
Pandora’s audience data measured 3.8x more accurate than the average publisher’s data.1 Use our audience solutions to reach the right consumers.
TLDR: We have a ton of data about our listeners, so we can help you make sure your audio ads resonate.
Don’t Forget Memory
Audio has long-lasting impacts on memory. We found that brand recall effects can last up to four months after the initial flight. Additionally, digital audio ads have a bigger impact on long-term memory than ads in other mediums.2
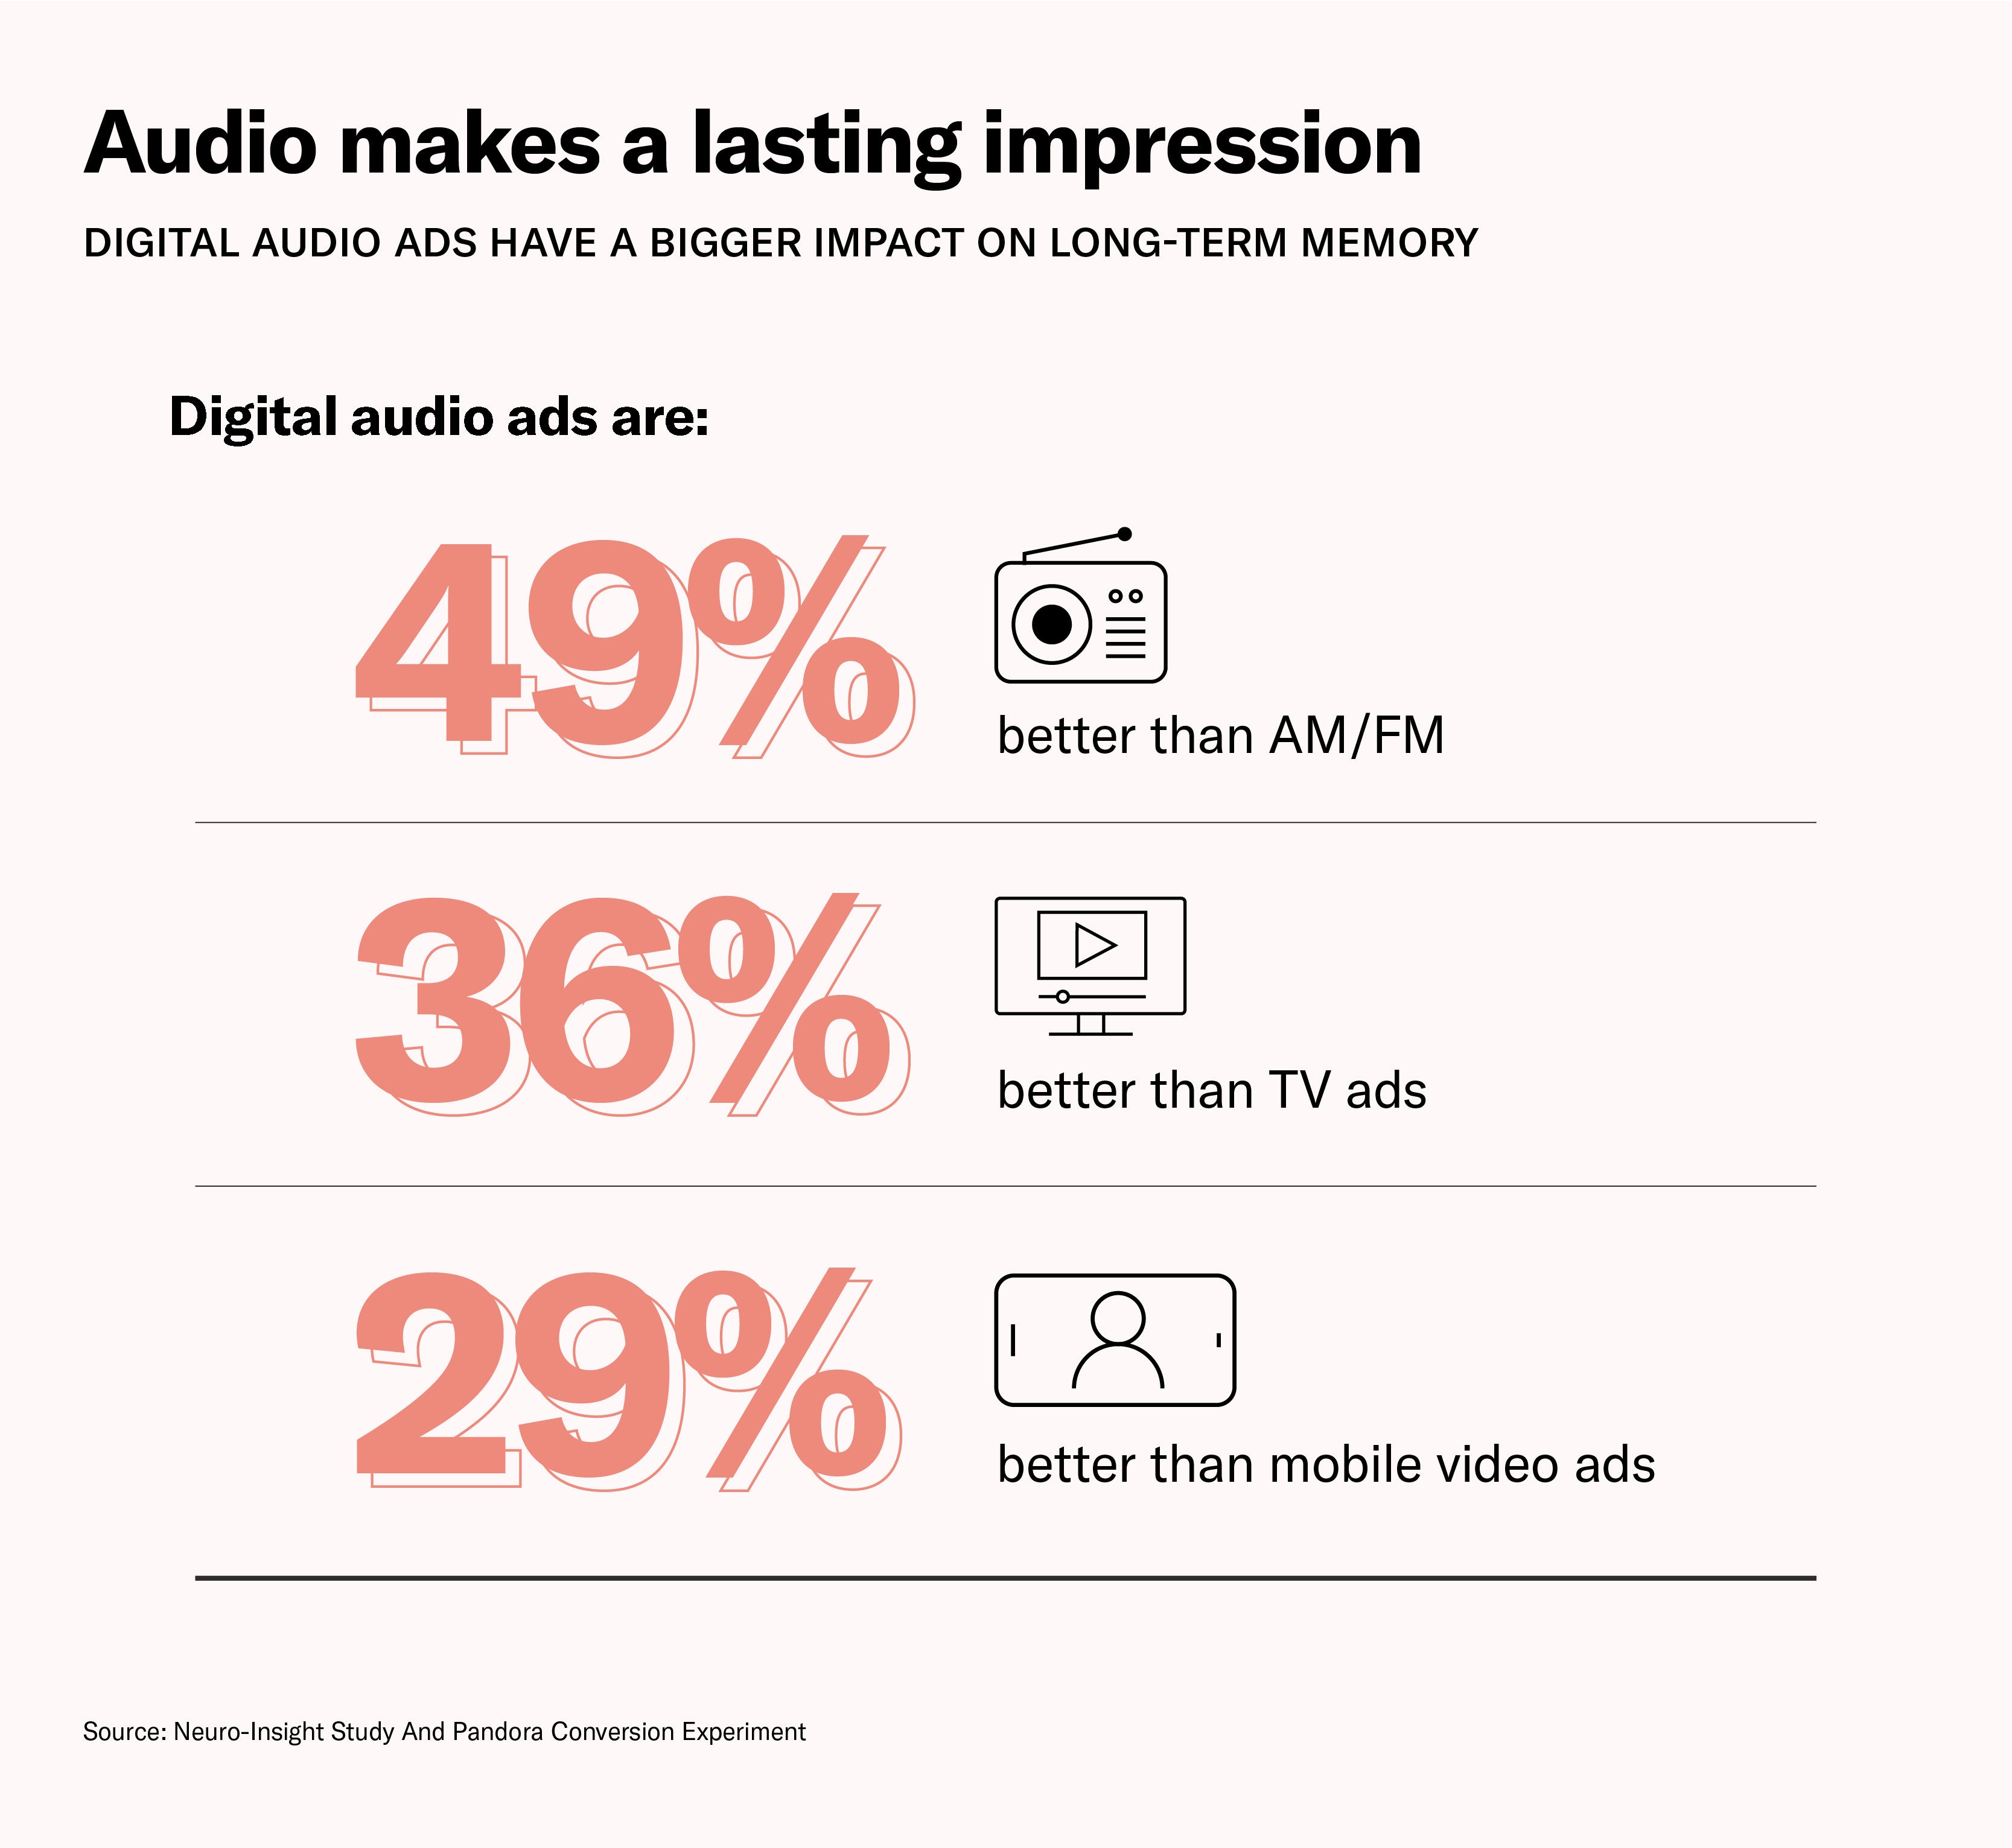
TLDR: Audio is an intimate medium, and because of that, it can drive long-term impacts on memory.
Find Your Lookback Window
When you combine the nature of listening with lasting memories audio creates, it’s important to consider how long your lookback window should be. In a durability experiment, we found that 18% of all conversions occurred three weeks after the campaign.
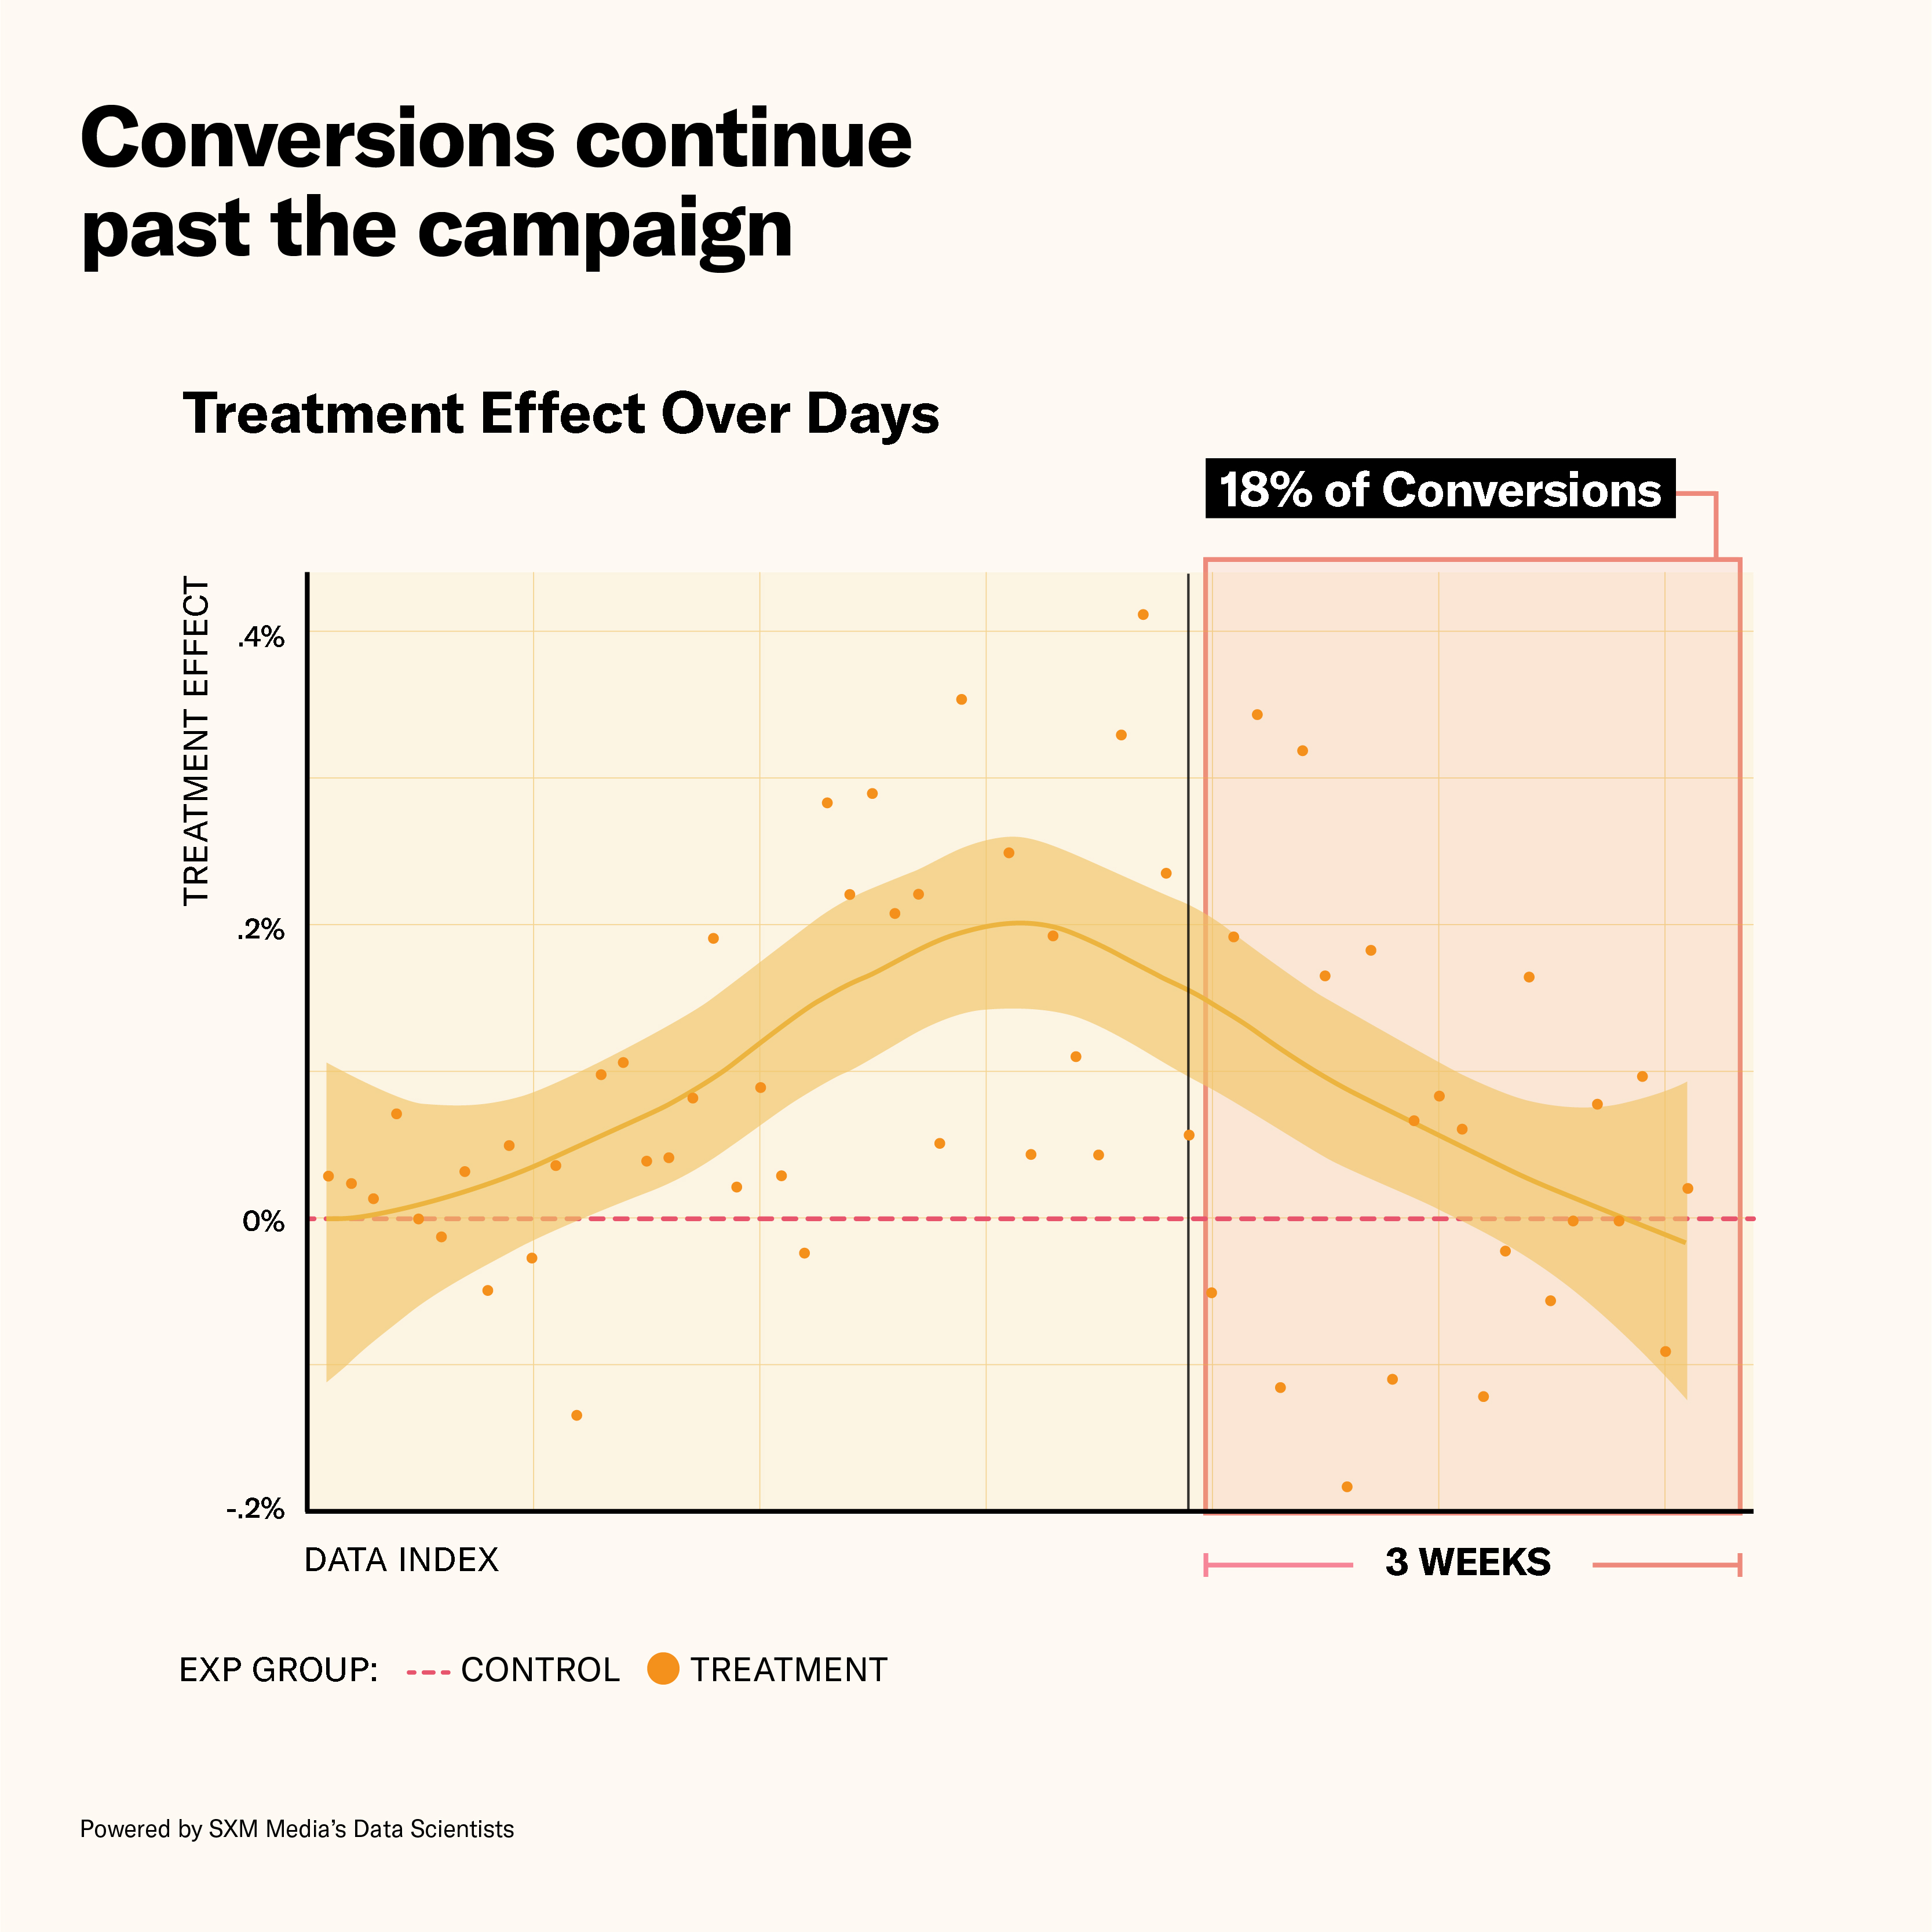
TLDR: Make sure your conversion windows are set up for audio—many conversions happen weeks after a flight ends.
Factor in the Halo Effect
You know, that tendency for positive brand impressions to resonate. Two brands measured sales lift using Nielsen Catalina Solutions, including sales lift across the brand’s entire portfolio of products. One drove over 1.5x ROAS and the other drove 8% sales lift across products in the brand’s portfolio beyond the one advertised.
TLDR: Audio is effective at driving halo effects, meaning you may be undervaluing the true power of audio.
Measure Audio by Its Merits
Hear this TLDR: You have to measure digital audio campaigns in ways that make sense for the medium. And we can help you do that with quality data and research—up and down the funnel, though the lookback window, and all the way around the halo effect.
Ready to learn more about what you can measure with audio? Let’s chart the course of your next campaign.
Sources
1. mDAR Study
2. Neuro-Insight Study And Pandora Conversion Experiment